
Architects and Planners across the country are harnessing the potential of Big Data to build information-laden city-scale models. By gathering and synthesizing such factors as traffic, energy usage, water flows, and air quality, the urban design field is hoping to layout smarter, more efficient, and more resilient forms of development. John Gendall logs on to find out more.
Scan the bookshelf of any urban designer or planner who graduated after 1980, and you will very likely spot a copy of The Social Life of Small Urban Spaces, by William H. Whyte, the journalist and consultant to the New York City Planning Commission who advocated a new, more empirical way of making urban areas. Cities, he reasoned, ought to be studied with the eyes of a scientist, subjected to a sort of post-occupancy analysis providing quantitative insight into just how urban spaces performed. While his approach now has so much currency as to seem obvious, his technique comes off as quaintly primitive. Through the 1970s, equipped with a camera, pen, clipboard, reams of paper, and several research assistants, Whyte would ensconce himself in public areas for weeks and months on end to painstakingly document figures like use, traffic, and interactions, culminating in his 1980 publication.
Thirty-five years later, cities around the world are carrying out extensive performance analyses, but rather than relying on an intrepid clipboard-toting individual, they are turning to another source: Big Data. Having reshaped other industries—finance, public health, manufacturing, and, with Building Information Modeling, architecture—the wheels of Big Data are increasingly being set on cities. With that comes access to immense and complex sets of information that city planners and urban designers can now harness to make cities perform better. Applications abound: traffic can be made to move quicker, energy consumption can be brought down, view corridors preserved, and all of this can happen while budgets get trimmed. The “big” in Big Data refers not just to volume (even though there are unprecedented amounts of information churning in its orbit); it also refers to the number of different data sets. “We think of Big Data as a degree of complexity, not simply volume,” said Matthew Shaxted, a computational designer at SOM City Design Practice.” This makes it particularly well suited to sort through webs of changing interdependencies, or, put another way, through cities.
 |
||
|
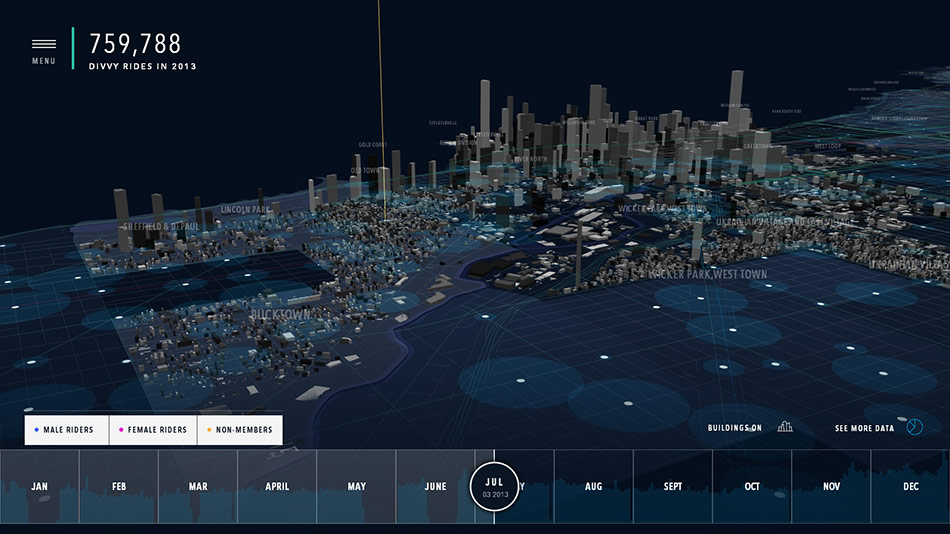
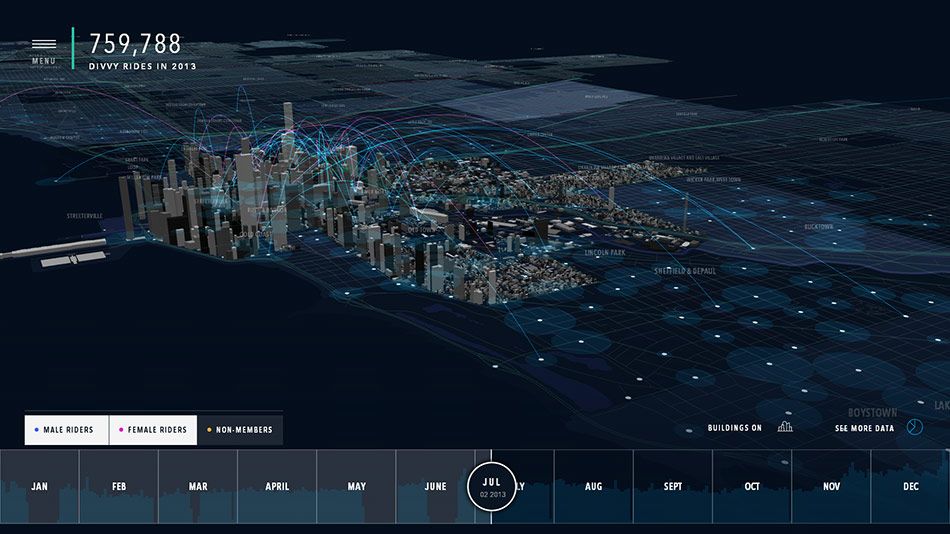
Chicago: City of Big Data Chicago: City of Big Data, an exhibition currently on view at the Chicago Architecture Foundation, examines the interaction between digital and physical infrastructure in the Windy City and beyond. Large-scale data visualizations show, for example, the number and location of tweets sent—clustered in the LOOP—the number and distance of Divvy bike-share rides—downtown to the neighborhoods—and the frequency and location of 311 calls, many of which come from higher crime, outlying areas. Curators worked with IBM and SOM Chicago to interpret the data and develop the visualizations, making the virtual and lived realities of Chicagoans legible to the public in a new way. |
||
 |
 |
|
|
Courtesy SOM Chicago
|
||
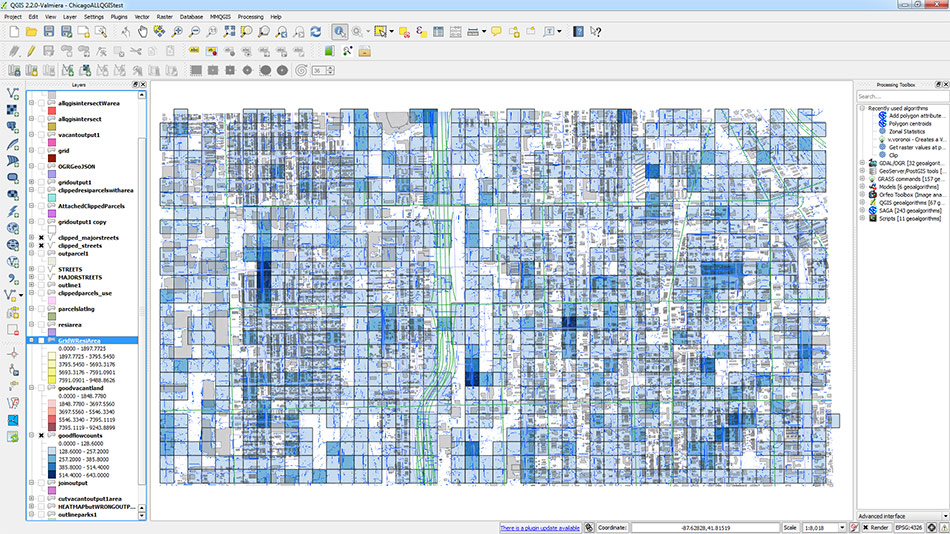
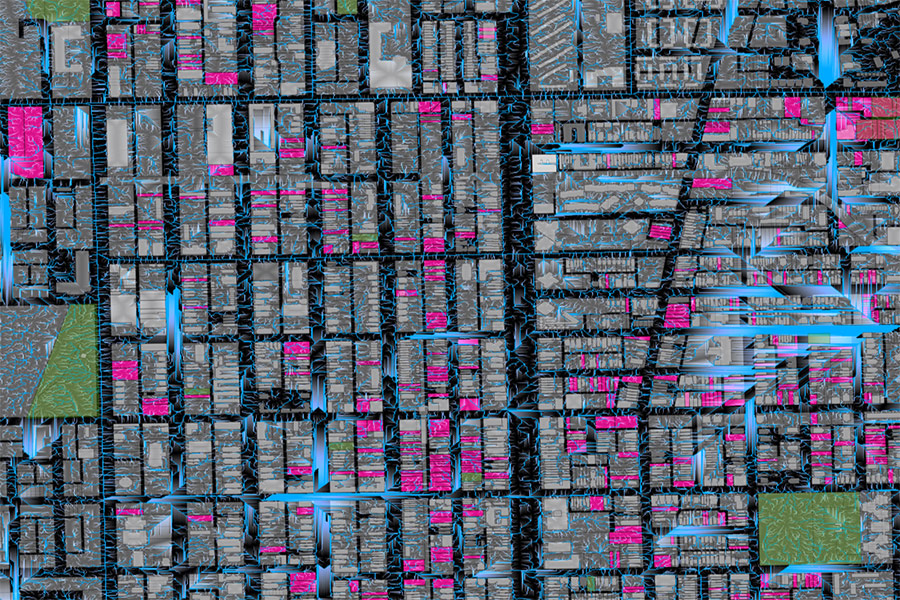
Take urban flooding, for example. With so much at stake, municipalities have started wrangling data as a way to become more resilient in the face of climate risks that are becoming increasingly hard to predict. In Chicago, where rain events perennially cause widespread basement flooding, the city’s Department of Planning and Development partnered with SOM and the University of Chicago to get out ahead of what has become a costly problem. Aggregating high-resolution point cloud data from the city, the team developed a model for how water flows and pools across Chicago. As Shaxted explained, “we then combined this with other open source data—vacant lots, single-family residential parcels, etc.—and we were able to determine locations across the city where green infrastructure would lead to the highest impact.”
But as it is with any information, big data is only as useful as it can be processed and aggregated. Invite eight million New Yorkers to lodge complaints over 311, and you will need a way to analyze whatever lands on the receiving end of that line. Cities are tooling up to do that work. In 2013, for example, New York City established the Office of Data Analytics, outfitted to aggregate data and collaborate with other city agencies in using that information. Cities, from San Francisco and Miami to Boulder and Kansas City, are similarly committed to leveraging data to tackle local challenges. Because volumes of available information exceed the capacity of any single municipality to apply it, and because cities make much of it publicly available, architects, planners, and urban designers have a new, powerful resource—and a role to assume. “When working in 2-D, it used to be that designers would come up with one or two options, then clients end up with one of those,” said Jay Mezher, the Director of Virtual Design and Construction at Parsons Brinckerhoff. “The advantage with Big Data in design is that there is so much information that you can make the best decision for each project.”
Because it synthesizes complex information, these data-laden visualizations can have a clarifying effect on project coordination. As Mezher explained, “with infrastructure jobs, it’s not just one client making the decisions. It’s sometimes five or ten stakeholders—cities, counties, agencies—so any decision needs to go through many different layers.” For its work on the State Route 99 tunnel, in Seattle, Parsons Brinckerhoff built eight different models within the city context, comparing eight different scenarios that involved underground utilities, all underground facilities, alignments, and an environmental impact statement.
This is what Justin Lokitz, a senior product line manager at Autodesk, calls “horizontal building information modeling.” To carry out that modeling, the company developed InfraWorks, the software used for the Seattle tunnel design that, as he said, “brings in data from different sources and allows different constituents and stakeholders to act on it—it makes data real.”
This modeled data allows these stakeholders to see the ramifications of design decisions. “For a highway job, for example, it’s not just cars illustrated on a road—it’s actual traffic patterns,” said Mezher, underscoring the distinction between projected traffic versus representing the traffic in real time, as found in data. “Then,” he added, “if you need to consider other factors—noise volumes, carbon emissions, construction schedules—you can incorporate that data, too, for clients to understand different aspects of a job.”
 |
||
|
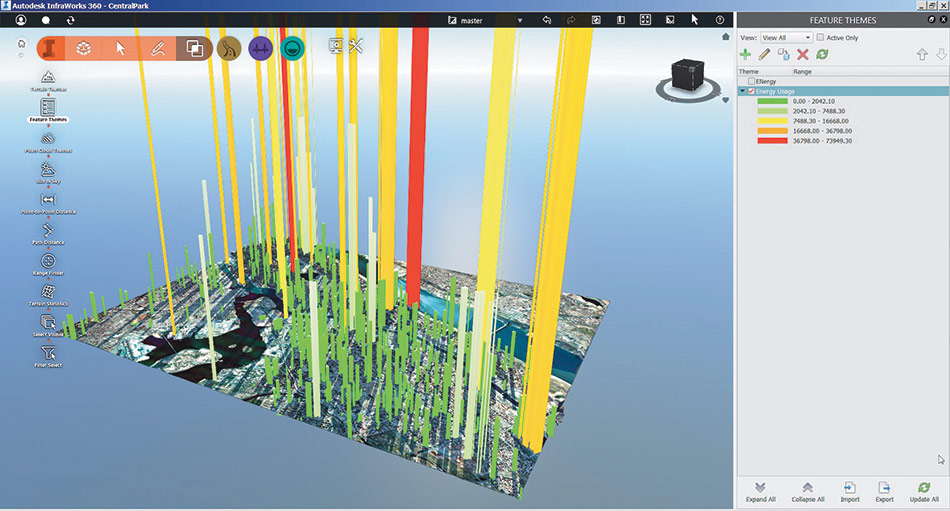
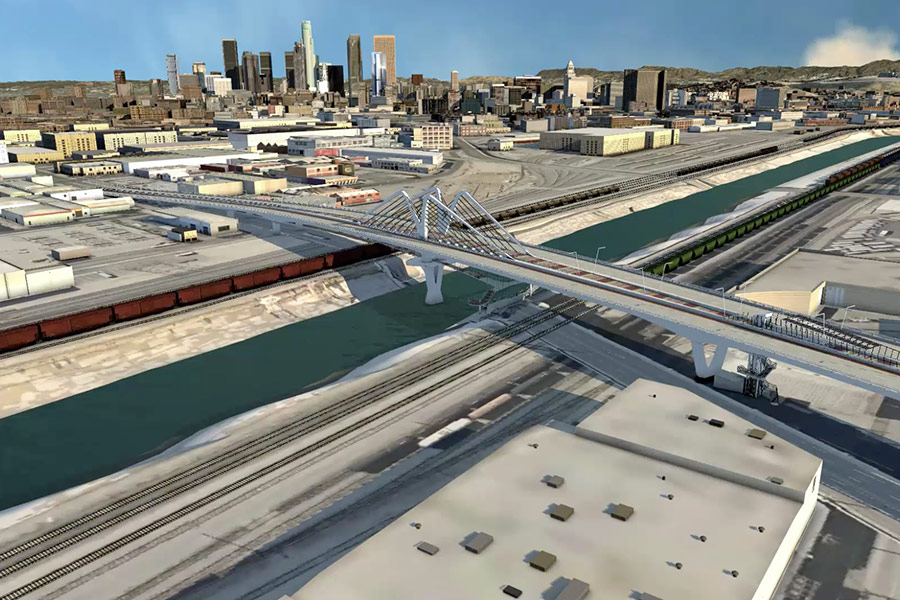
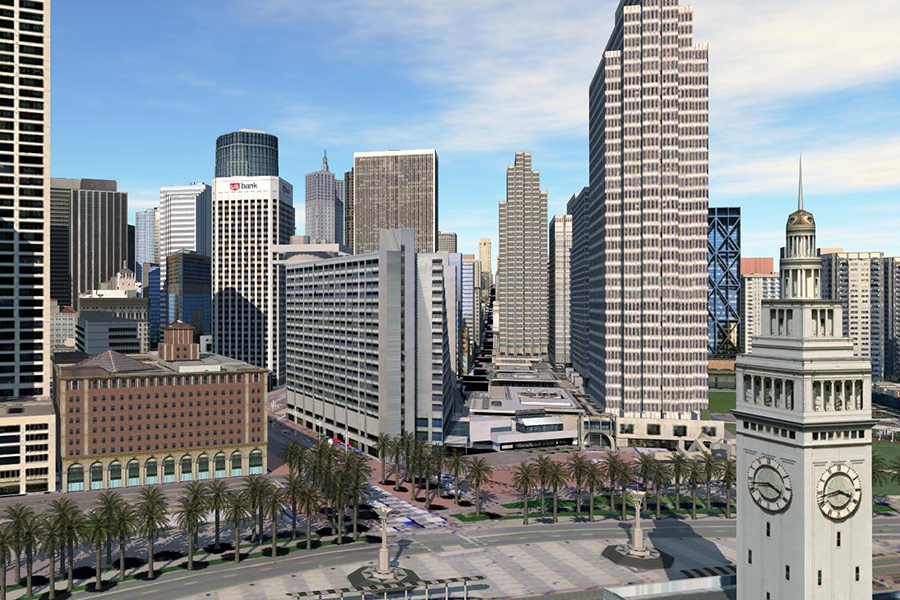
InfraWorks by Autodesk InfraWorks, a new data software for infrastructure developed by Autodesk, is modeled on BIM, but uses “horizontal” information, including traffic patterns—which is richer information than just vehicle counts—noise volumes, construction schedules, and pollution emissions. Multiple government agencies can access the information to coordinate work, and advocates and neighborhood groups can track potential impacts on affected communities. This information can be used to model how design changes—to highways, tunnels, rail lines, etc.—can shape outcomes before construction begins. |
||
 |
 |
|
|
Courtesy Autodesk
|
||
Long the very apotheosis of permanence, modern cities have come to be made at something of a generational pace, with major works grinding their way through approval and construction (with fingers crossed for their effectiveness). Now, as their flows of information become better understood, cities seem to be moving toward something more fluid, where projects can be tailored for maximum efficiency, and where they can be tweaked and adjusted in light of changing conditions.
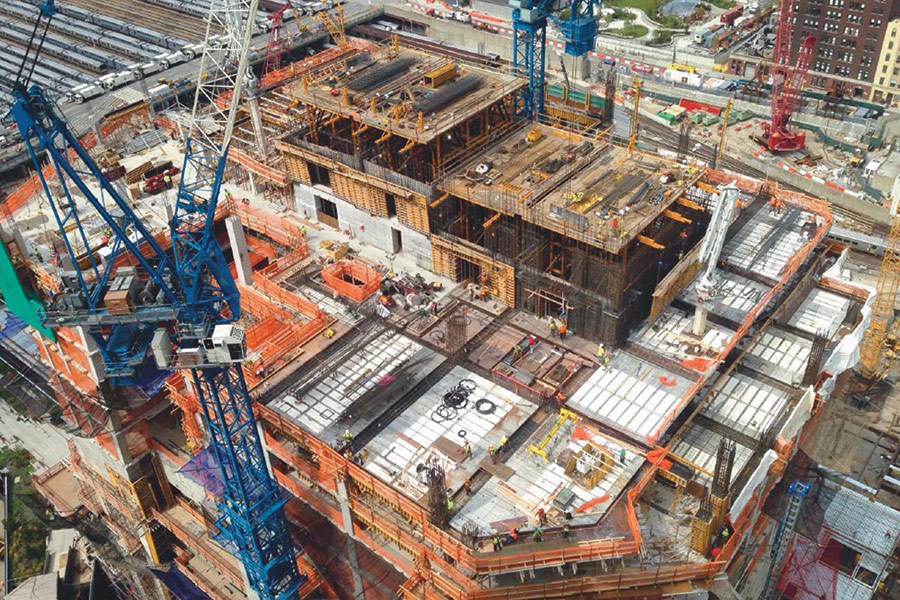
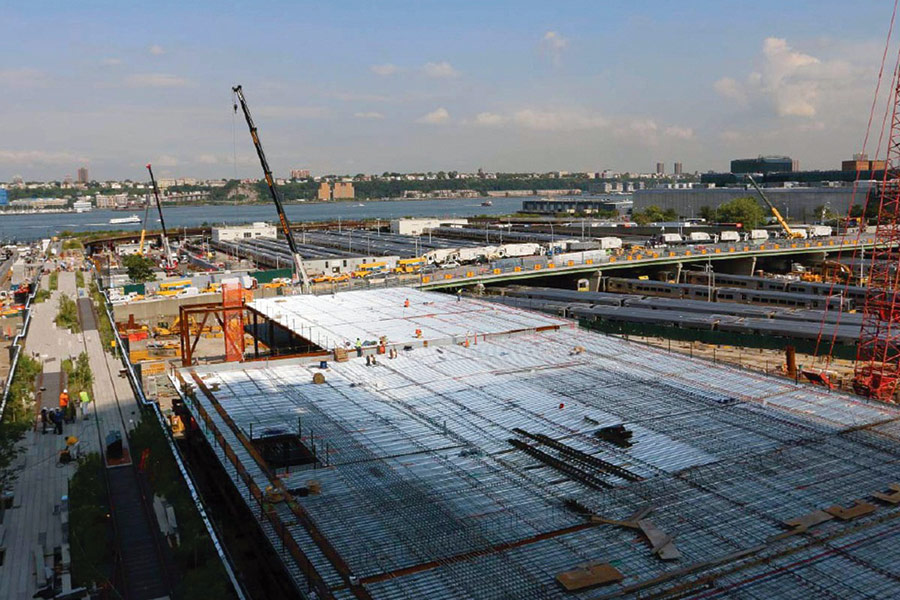
Consider Hudson Yards. Earlier this year, Related Companies and Oxford Properties, the developers of the over $20-billion Manhattan development, announced a partnership with New York University’s Center for Urban Science and Progress (CUSP) to make Hudson Yards what they called “the nation’s first ‘quantified community.’” Working with CUSP, the developers will gauge metrics like pedestrian flows, air quality, energy usage, and waste disposal. As Related president Jay Cross said in a statement, “we will harness big data to continually innovate, optimize and enhance the employee, resident, and visitor experience.” Seen in another way, CUSP will be doing the work of William H. Whyte, but on a scale unimaginable to the 20th century observationist.
“Data is not new, it’s something city planners have always used,” said Kelly Floyd, who co-curated Chicago: City of Big Data, on view through August 2015 at the Chicago Architecture Foundation, where she is manager of exhibition and visitor engagement. “Daniel Burnham included train schedules and census data in his urban plans. Big Data is a buzzword now, but it’s important for people to know how their environment will be affected by it.”
To that end, researchers at MIT Media Lab are going after innovative ways to bring Big Data into the community engagement process, long the domain of sticky notes and colored markers. Its CityScope project has developed a tangible model that community members can manipulate in real time to determine just how their suggestions would perform. As Media Lab research scientist J. Ira Winder explains, “it gives the community members what a printed map and a marker could never give them: feedback.”
 |
||
|
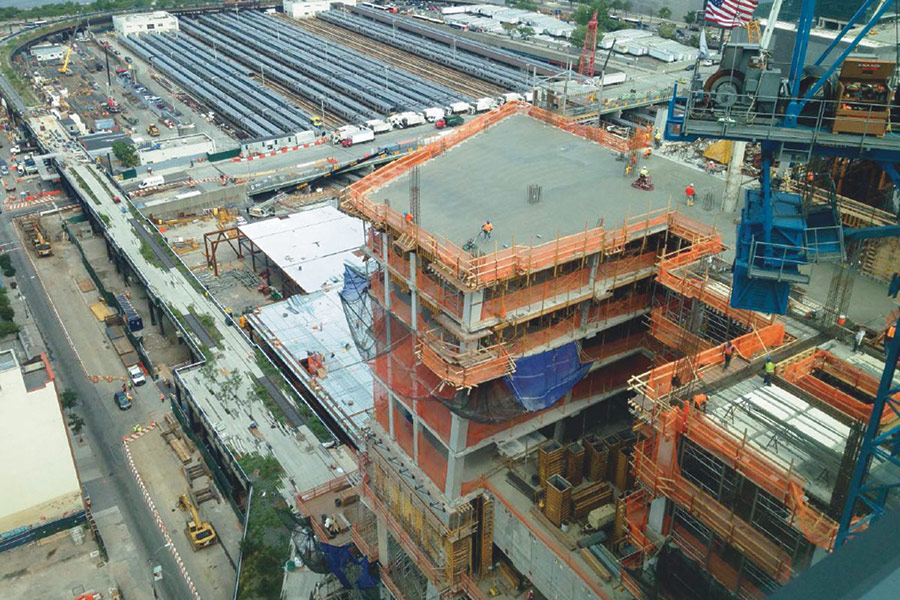
Hudson Yards/CUSP Private developers are also getting into the data game. At Hudson Yards, a vast new neighborhood now under construction on Manhattan’s far West Side, developers Related Companies and Oxford properties have teamed with New York University’s Center for Urban Science and Progress (CUSP) to make the neighborhood the most connected and analyzed in the city. Pedestrian and transit flows will be measured, along with retail traffic and dollars spent—serving both public and commercial interests. Energy, solid waste, and water benchmarking will also be instituted to improve environmental performance and cut costs for the building owners. Residents and area employees will also be able to opt-in to health monitoring applications, which will help demonstrate the beneficial aspects of living and working in this new urban district. |
||
 |
 |
|
|
Courtesy Related Companies
|
||
“The models work to augment existing models for stakeholder meetings,” he added. “These would provide evidence-based community engagement processes.” Likening them to Lego blocks, Winder said they would allow participants to see how certain changes would affect the entire design. In this way, it bridges the gap between experts and non-experts. Rather than having community members mark up drawings and maps at a public forum, then rolling them up and having planners and experts retreat with them to evaluate the efficacy of the suggestions, the CityScope model would short-circuit that divide, allowing community members to get real-time feedback. As Winder puts it, “a lot of the knowledge of experts can now be imbued in the data.”
Placed in William H. Whyte’s timeline, the use of Big Data in urbanism would be somewhere in the mid-1970s. Hypotheses have been made, tools developed, observations made, and trials run, but it is still an emerging field.
“I always preface conversations about this topic with the disclaimer that in terms of using data sources, we are still at the tip of the iceberg,” said Shaxted. “We are just starting the exploration, and we don’t fully understand what the outcomes will be.”
If the degree to which BIM changed buildings can be made to foreshadow Big Data’s potential in urbanism, the city scale is set to change significantly, even radically. “In other disciplines, there has been a lot of emphasis on certain scales—the cell, for example, or the brain,” said Shaxted, adding that this attention normally leads to big breakthroughs. “The city as a unit of study is just getting started, so once discoveries are made into urban systems, perhaps we’ll begin to see completely new ways of making cities.”
 |
||
|
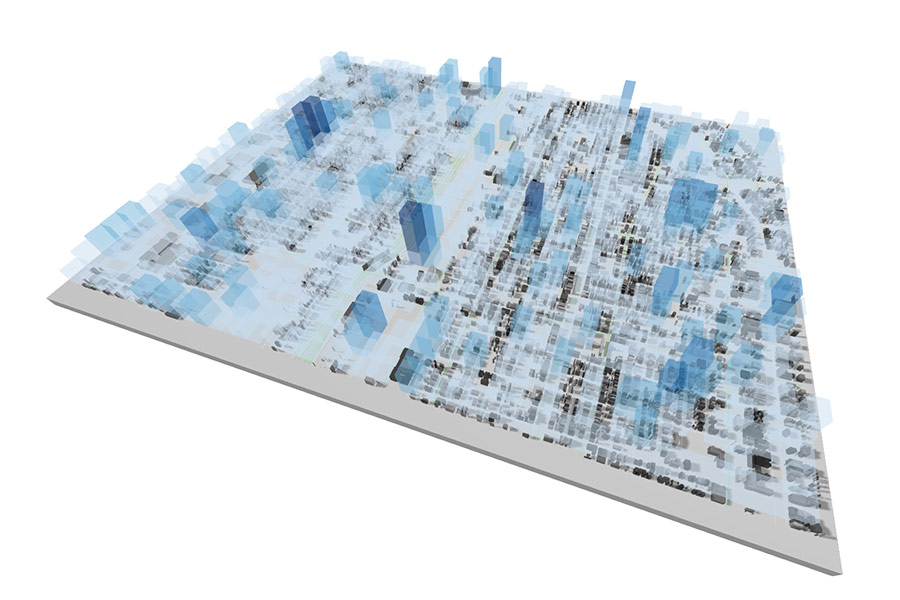
SOM City Design Practice for Chicago’s Department of Planning and Development Recognized as experts in the field, SOM Chicago’s City Design Practice has been asked to help solve one of the Windy City’s chronic problems: basement and street flooding and sewage overflows. Working with the University of Chicago and the Department of City Planning and Development, the urban design team developed detailed analysis of open space, impermeable surfaces, and water flows. The data will be used to precisely target green and grey infrastructure interventions to maximize their impacts and minimize capital costs. The project shows how the deployment of Big Data projects, a relatively new field and practice, is already being used to address real world challenges. SOM Chicago previously used similar analysis in the Chicago Lakeside Master Plan, the plan for a massive new neighborhood on Chicago’s South Side, where stormwater will be managed on site. |
||
 |
 |
|
|
Courtesy SOM
|
||