


One silver lining during the COVID-19 pandemic’s calamities was a drop in air pollution as economic activity and motor-vehicle use declined. Surprisingly, though buildings account for over 70 percent of New York City’s greenhouse gas emissions, new research shows that changes in occupancy patterns during the first year of the pandemic did not yield comparable air-quality benefits. Improving the city’s emissions will apparently take more than commuters shifting from subways to Zoom.
In New York’s larger buildings, energy use dipped during the pandemic while reductions in CO2 emissions were less than expected, according to a recent study by the Urban Green Council (UGC), a nonprofit research group that advocates for sustainability and energy efficiency in buildings. Analyzing 2020 benchmarking data on energy use, water use, and emissions in commercial and multifamily residential buildings as collected in buildings over 50,000 square feet under Local Law 84 since 2010, UGC researchers found that reduced office occupancy (down by at least 40 percent) correlated with only a 14 percent drop in energy use. Hotels, meanwhile, experienced a 23 percent decrease in energy use. While overall energy use fell by 9 percent citywide, carbon emissions dropped by just 7 percent.
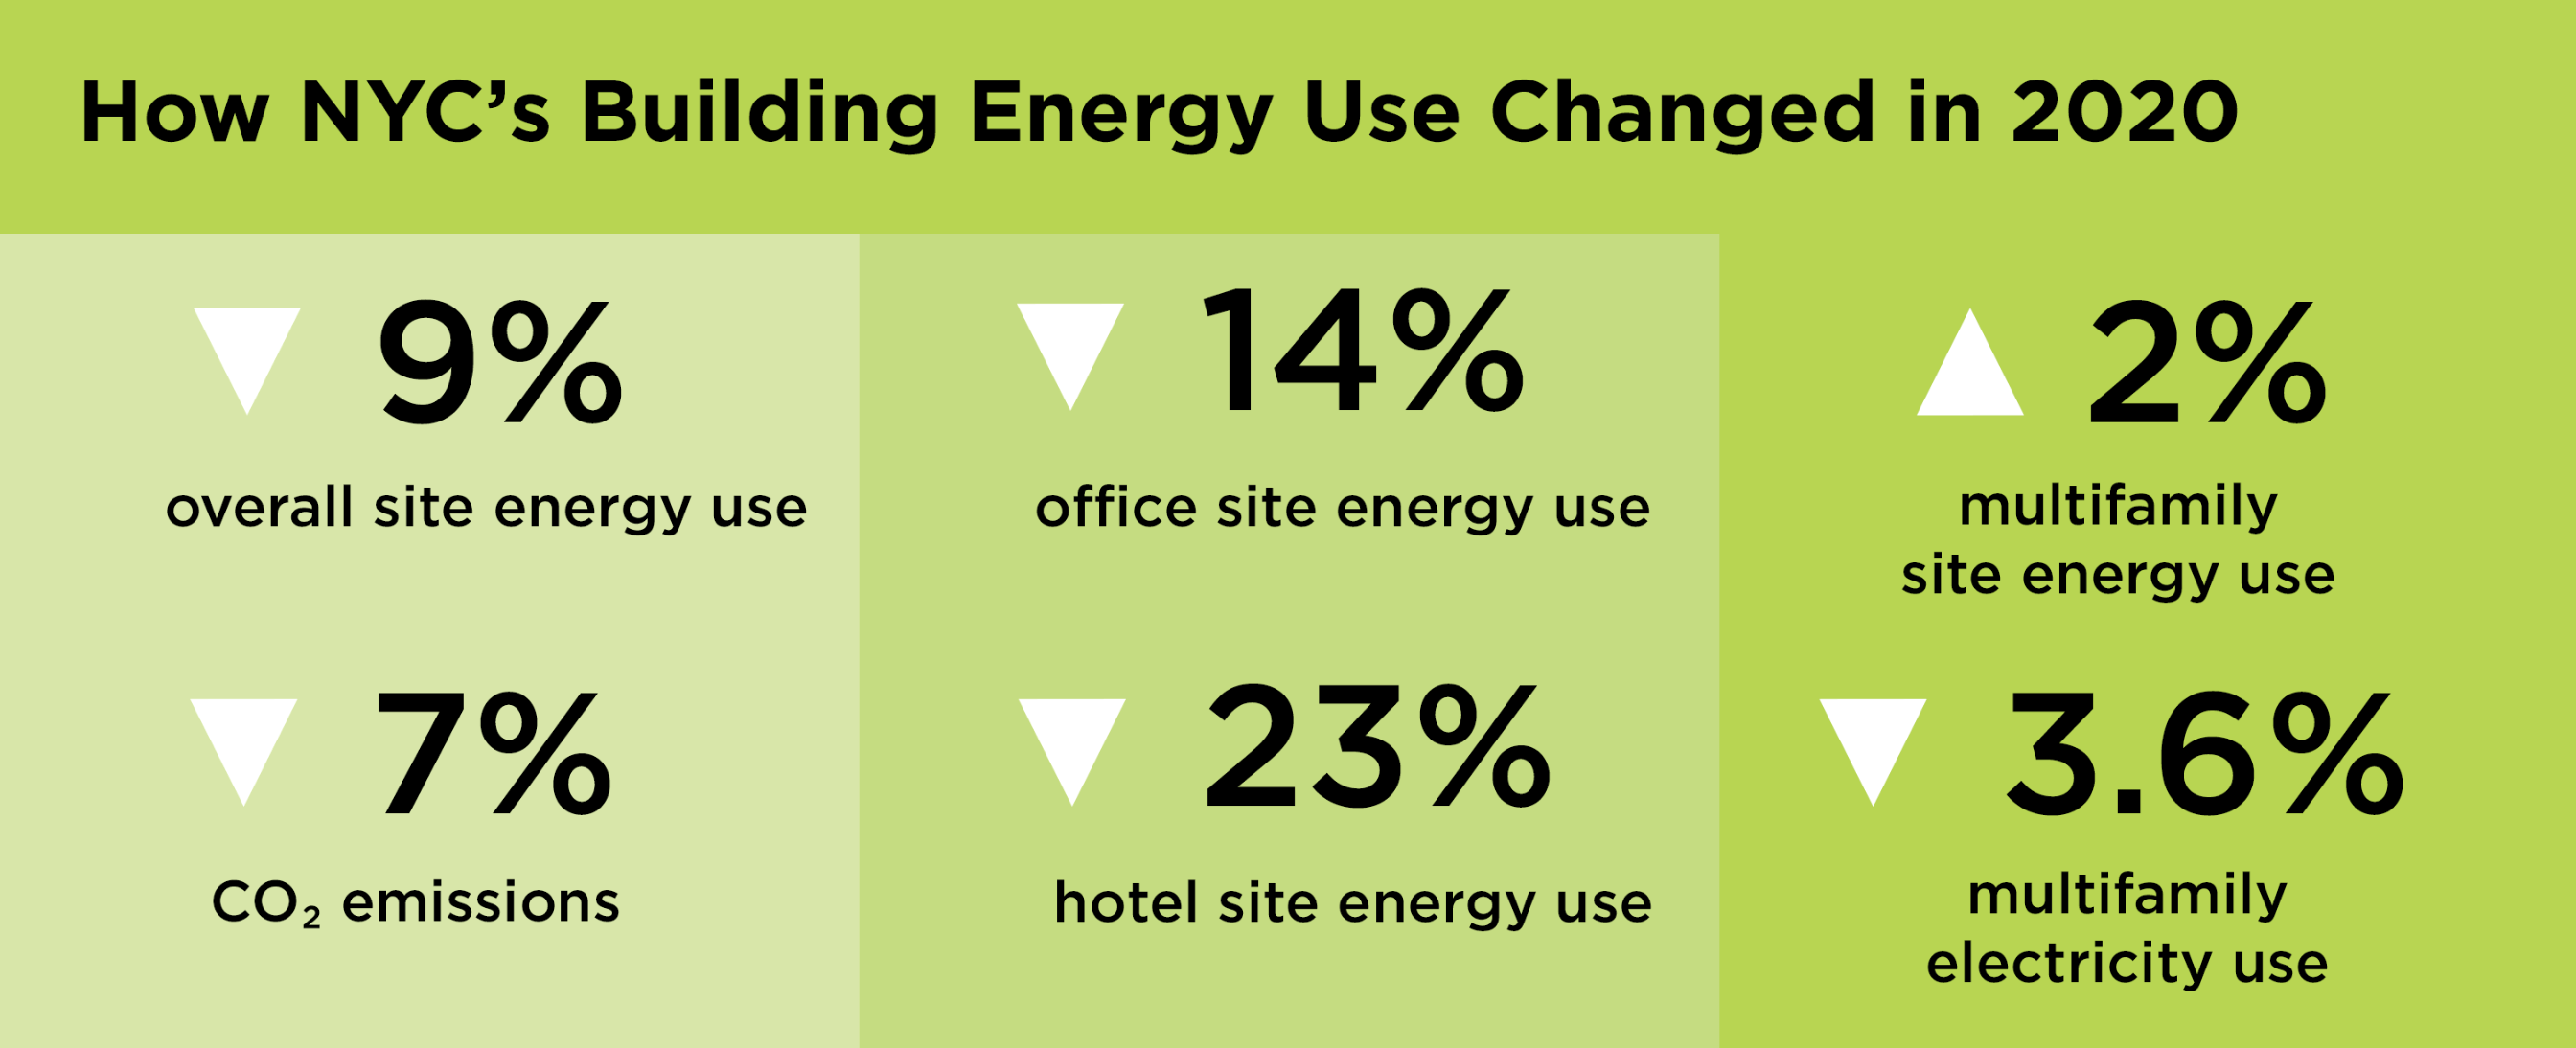
Multifamily electricity use citywide declined by 3.6 percent overall, with locally skewed effects: while Manhattan’s fell 8 percent, it increased in every other borough. Additionally, on-site energy use in multifamily residential buildings actually rose by 2 percent, largely from fossil fuel sources like furnaces, boilers, and water heaters.
If New Yorkers’ COVID experiences involved less time in the office and more at home (with some exiting Manhattan for other locales), this mix of reversible and permanent changes didn’t drastically reshape the city’s environmental footprint. “We all thought we knew everything we needed to know about buildings,” said UGC’s CEO John Mandyck. “I think the pandemic has taught us once again that there are new things to learn about buildings and how we can design them and operate them to be more efficient.” He identified three surprises in the new findings: the small decline in carbon emissions, the discrepancy between declines in occupancy and in energy use, and the rise in electricity use in the four outer boroughs.
Some of the difference between energy use and carbon emissions can be explained by timing, as use of the nuclear Indian Point Energy Center was phased out in 2020 and 2021, an arguably prudent move to prevent emergencies that resulted in the loss of a relatively clean energy source. When Indian Point’s Unit 2 was shut down in April 2020, its roughly 7,500 MWh output of zero-carbon power was largely replaced with three gas-fired plants. “Our grid got dirtier during the pandemic,” Mandyck said. “We didn’t see as large a carbon reduction as we did an energy reduction, so that underscores the fact that we need to green our grid, and we’re on path to do that.” A Public Service Commision decision in April to approve two new transmission lines, he notes, will “essentially replace the carbon-free power that Indian Point provided” with hydroelectricity from Canada and solar, wind, and hydro from upstate.
Occupancy estimates vary, complicating analyses of the relation to energy use. Lockdown conditions lowered occupancy of commercial buildings by as much as 90 percent at an early point in the pandemic in 2020, according to data from property management firm Kastle Systems. UGC used a more cautious figure for occupancy declines—“anywhere between 40 and greater percent,” Mandyck said. “Some estimates are 90 percent. The point is that the base load of buildings that were primarily empty or much lower occupancy was a lot higher than we thought. In other words, we’re still using a lot of energy to power buildings that don’t have as many people in them.”
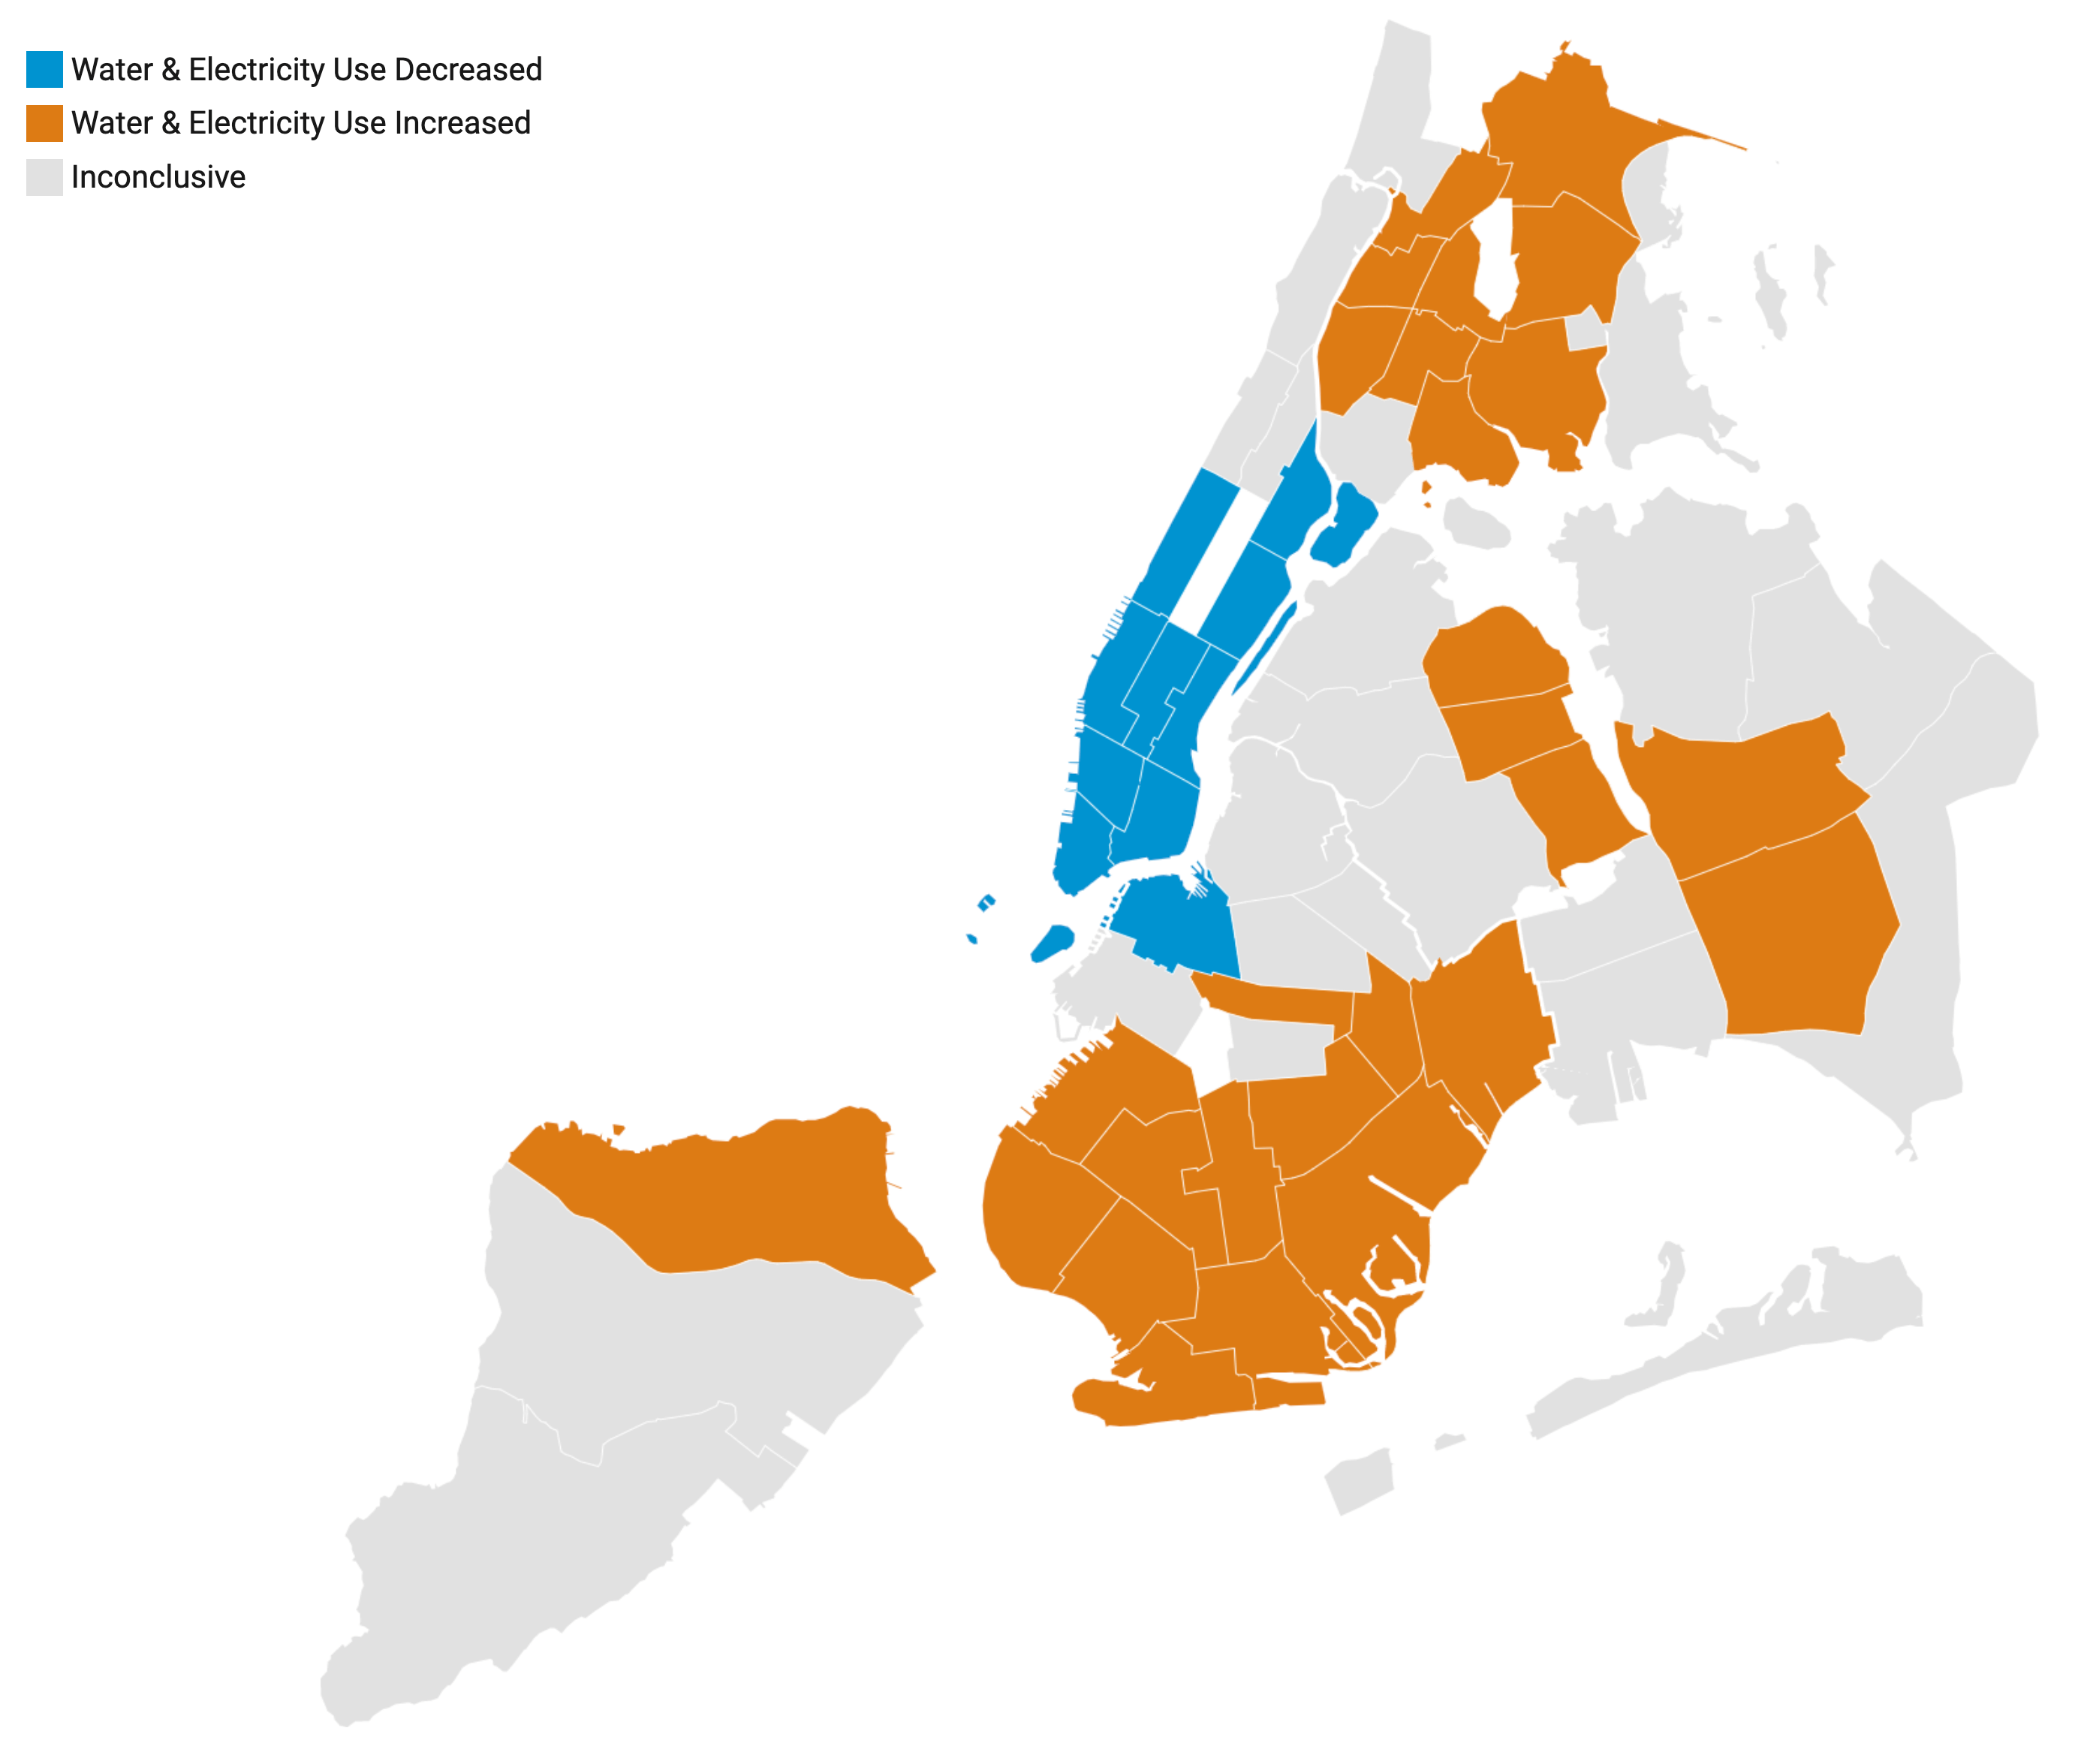
Mandyck interprets the rise in residential electricity use everywhere but Manhattan as indicating that “during the pandemic, multifamily buildings really became mixed-use buildings; they became people’s offices.” The 8 percent drop in Manhattan electricity use, combined with data on water use, suggests “that it’s possible that residents in Manhattan left the city, and so energy use went down based on that, but it masks a broader trend in the sense that across every other borough, the electricity use went up.”
UGC research director Sean Brennan told AN that the organization’s study analyzed water use as a proxy for occupancy. “If we saw a water decrease and electricity decrease,” Brennan said, “we flagged that neighborhood, as it seemed like people left and the electricity went down. The opposite happened in southern Brooklyn, the Bronx, and outer Queens, where both went up. […] There is some alignment with what you traditionally think of as low- and middle-income areas that had water use go up, and then, of course, [in] most of Manhattan everything went down.”
“The broader picture,” Mandyck said, “is the value of the benchmarking data in the first place. We’re now 11 years into benchmarking in New York City; it’s one of the richest data sets in the country for building energy use.” Brennan noted that “New York City is unique in that it has a lot of experts: practitioners, designers, as well as these nonprofit folks like us that are doing the research. Typically, other cities that have these programs, like Boston or Washington, DC, keep it in-house, so the mayor’s office might do the analysis themselves, but we’re lucky in New York City to have a long history of open data.” Chicago’s 2020 benchmarking report claimed a 25 percent emissions reduction in buildings over 50,000 sf since 2016; data from Philadelphia and San Francisco extend only through 2019; citywide reports are generally far less accessible than reports on power producers.
Of New York’s 1 million buildings, Mandyck said, Local Law 97, which caps emissions by 2024 for buildings over 25,000 square feet, “covers about 50,000 of them. […] That’s about 60 percent of the city’s floor area and about half of all building emissions.” The performance of the remaining 950,000 smaller buildings goes unmeasured and thus is harder to manage. “I think over the course of the next year or so, you’ll start to see policy proposals being floated by various government agencies to do that,” he added.
Conserving energy and reducing carbon emissions may work in parallel, but they should be viewed as distinct processes, Mandyck noted. “The finding points out very, very clearly why energy is different than carbon,” he notes. “Energy use went down; carbon didn’t go down as much.” In converting the city’s chief carbon emitters from on-site fuels to a renewable electrical grid, Local Law 97’s focus on carbon is “a new language that many people have to learn,” Mandyck said. “We’ve all become adept at understanding the energy language, but the carbon language is different.” He concluded, “As a society, we have to become a whole lot more literate about carbon.”
Bill Millard is a regular contributor to AN.