


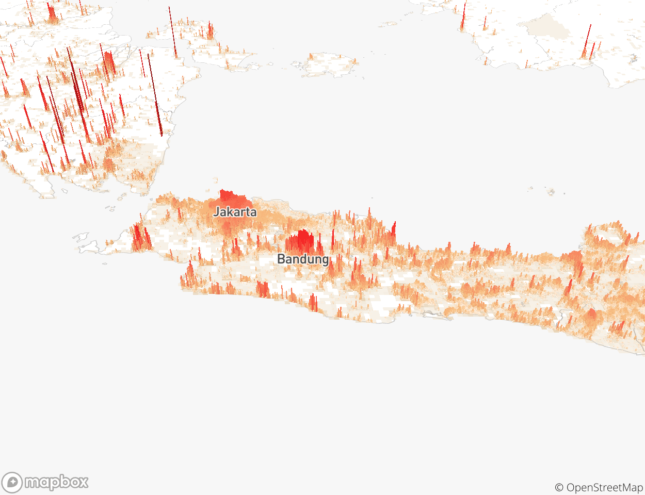
Maps are cool, maps are fun, maps show us things in the world that we couldn’t otherwise see. Over at The Pudding, Matt Daniels has extruded block-by-block population data for some of the world’s major cities to give viewers fine-grain insight into population distribution across the core and metro areas. New York, with Manhattan at the center, resembles a geyser just before gravity intervenes, while nearby but less dense locales like Philadelphia, D.C., and Boston look like a teenager’s cheekbone in a Clearasil ad. (No shade towards the Northeast Corridor, I swear!)
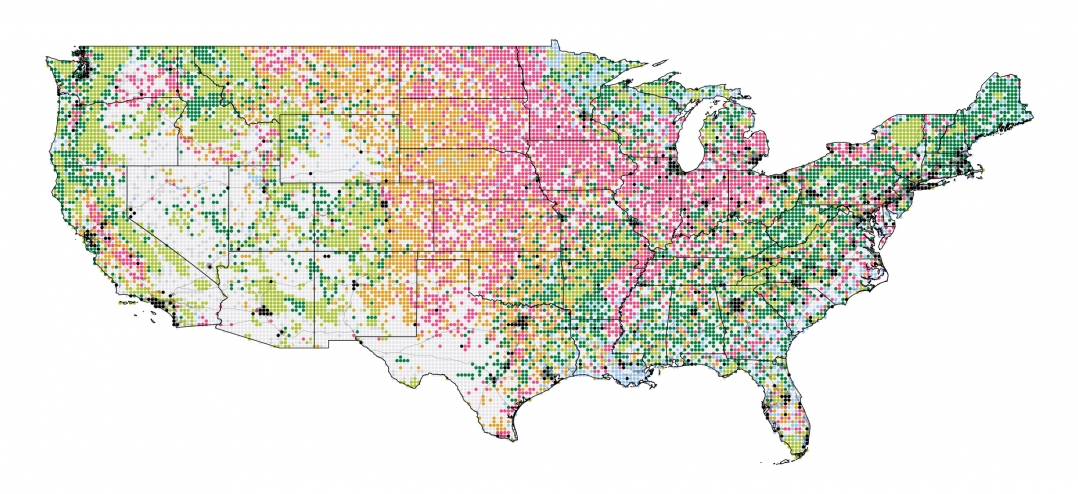
Daniels copped the data from the Global Human Settlement Layer and processed it using Google Earth Engine. For areas like India and China where population counts are unreliable, the data appears a little noisy in map view. A detailed explanation of the data gathering and manipulation is available here.
Curious to see your city in bars? Head on over to Human Terrain.
h/t City Observatory